今天的文章主要介绍TensorFlow中TensorBoard Embeddings的使用
导入数据
1 2 3 4 5 6 7 8 9 10 11 12 13 14 15 16 17 18
| import matplotlib.pyplot as plt import tensorflow as tf import numpy as np import os from tensorflow.contrib.tensorboard.plugins import projector from tensorflow.examples.tutorials.mnist import input_data LOG_DIR = 'minimalsample' NAME_TO_VISUALISE_VARIABLE = "mnistembedding" TO_EMBED_COUNT = 500 path_for_mnist_sprites = os.path.join(LOG_DIR,'mnistdigits.png') path_for_mnist_metadata = os.path.join(LOG_DIR,'metadata.tsv') mnist = input_data.read_data_sets("MNIST_data/", one_hot=False) batch_xs, batch_ys = mnist.train.next_batch(TO_EMBED_COUNT)
|
得到如下结果:
1 2 3 4
| Extracting MNIST_data/train-images-idx3-ubyte.gz Extracting MNIST_data/train-labels-idx1-ubyte.gz Extracting MNIST_data/t10k-images-idx3-ubyte.gz Extracting MNIST_data/t10k-labels-idx1-ubyte.gz
|
创建embeddings
在这个例子中,就是训练数据的值。但是要知道想要可视化的变量的名称。
1 2
| embedding_var = tf.Variable(batch_xs, name=NAME_TO_VISUALISE_VARIABLE) summary_writer = tf.summary.FileWriter(LOG_DIR)
|
创建embeddings projector
这是嵌入可视化比较重要的一步,需要指定映射的变量,metadata文件的路径,以及sprits文件的路径。
1 2 3 4 5 6 7 8 9 10 11 12 13
| config = projector.ProjectorConfig() embedding = config.embeddings.add() embedding.tensor_name = embedding_var.name embedding.metadata_path = path_for_mnist_metadata embedding.sprite.image_path = path_for_mnist_sprites embedding.sprite.single_image_dim.extend([28,28]) projector.visualize_embeddings(summary_writer, config)
|
保存数据
TensorBoard从保存的图形中导入保存的变量。初始化会话和变量,并保存在日志路径中。
1 2 3 4
| sess = tf.InteractiveSession() sess.run(tf.global_variables_initializer()) saver = tf.train.Saver() saver.save(sess, os.path.join(LOG_DIR, "model.ckpt"), 1)
|
保存sprite图像
有三个比较重要的可视化的函数:
create_sprite_imagecreate_sprite_image:将sprit整齐的排列在方形的图片上。vector_to_matrix_mnist:MNIST特征导入的是向量而不是图像,这个函数可以将他们转化为图像。invert_grayscale:matplotlib中将0视为黑色,1视为白色。但是在TensorBoard中白色的背景看上去效果会更好,所以将他们进行翻转处理
处理之后将sprite图像保存,将向量转化为图像,翻转灰度值,创建并保存图像:
1 2 3 4 5 6 7 8 9 10 11 12 13 14 15 16 17 18 19 20 21 22 23 24 25 26 27 28 29 30 31 32 33 34 35 36
| def create_sprite_image(images): """Returns a sprite image consisting of images passed as argument. Images should be count x width x height""" if isinstance(images, list): images = np.array(images) img_h = images.shape[1] img_w = images.shape[2] n_plots = int(np.ceil(np.sqrt(images.shape[0]))) spriteimage = np.ones((img_h * n_plots ,img_w * n_plots )) for i in range(n_plots): for j in range(n_plots): this_filter = i * n_plots + j if this_filter < images.shape[0]: this_img = images[this_filter] spriteimage[i * img_h:(i + 1) * img_h, j * img_w:(j + 1) * img_w] = this_img return spriteimage def vector_to_matrix_mnist(mnist_digits): """Reshapes normal mnist digit (batch,28*28) to matrix (batch,28,28)""" return np.reshape(mnist_digits,(-1,28,28)) def invert_grayscale(mnist_digits): """ Makes black white, and white black """ return 1-mnist_digits to_visualise = batch_xs to_visualise = vector_to_matrix_mnist(to_visualise) to_visualise = invert_grayscale(to_visualise) sprite_image = create_sprite_image(to_visualise) plt.imsave(path_for_mnist_sprites,sprite_image,cmap='gray') plt.imshow(sprite_image,cmap='gray')
|
为了给mnist数据添加颜色,潜入可视化工具需要知道每一张图片的标签。这些信息保存在.tsv文件中。
文件中每一行包含:
Index是嵌入矩阵的索引,Label是MNIST特征的标签。
将数据写入metadata文件的代码如下:
1 2 3 4
| with open(path_for_mnist_metadata,'w') as f: f.write("Index\tLabel\n") for index,label in enumerate(batch_ys): f.write("%d\t%d\n" % (index,label))
|
运行
已经获得了MNIST的特征,现在就进行可视化。如果没有改变上面的任何变量,可以执行线面的命令进行可视化:
1
| tensorboard –logdir=minimalsample
|
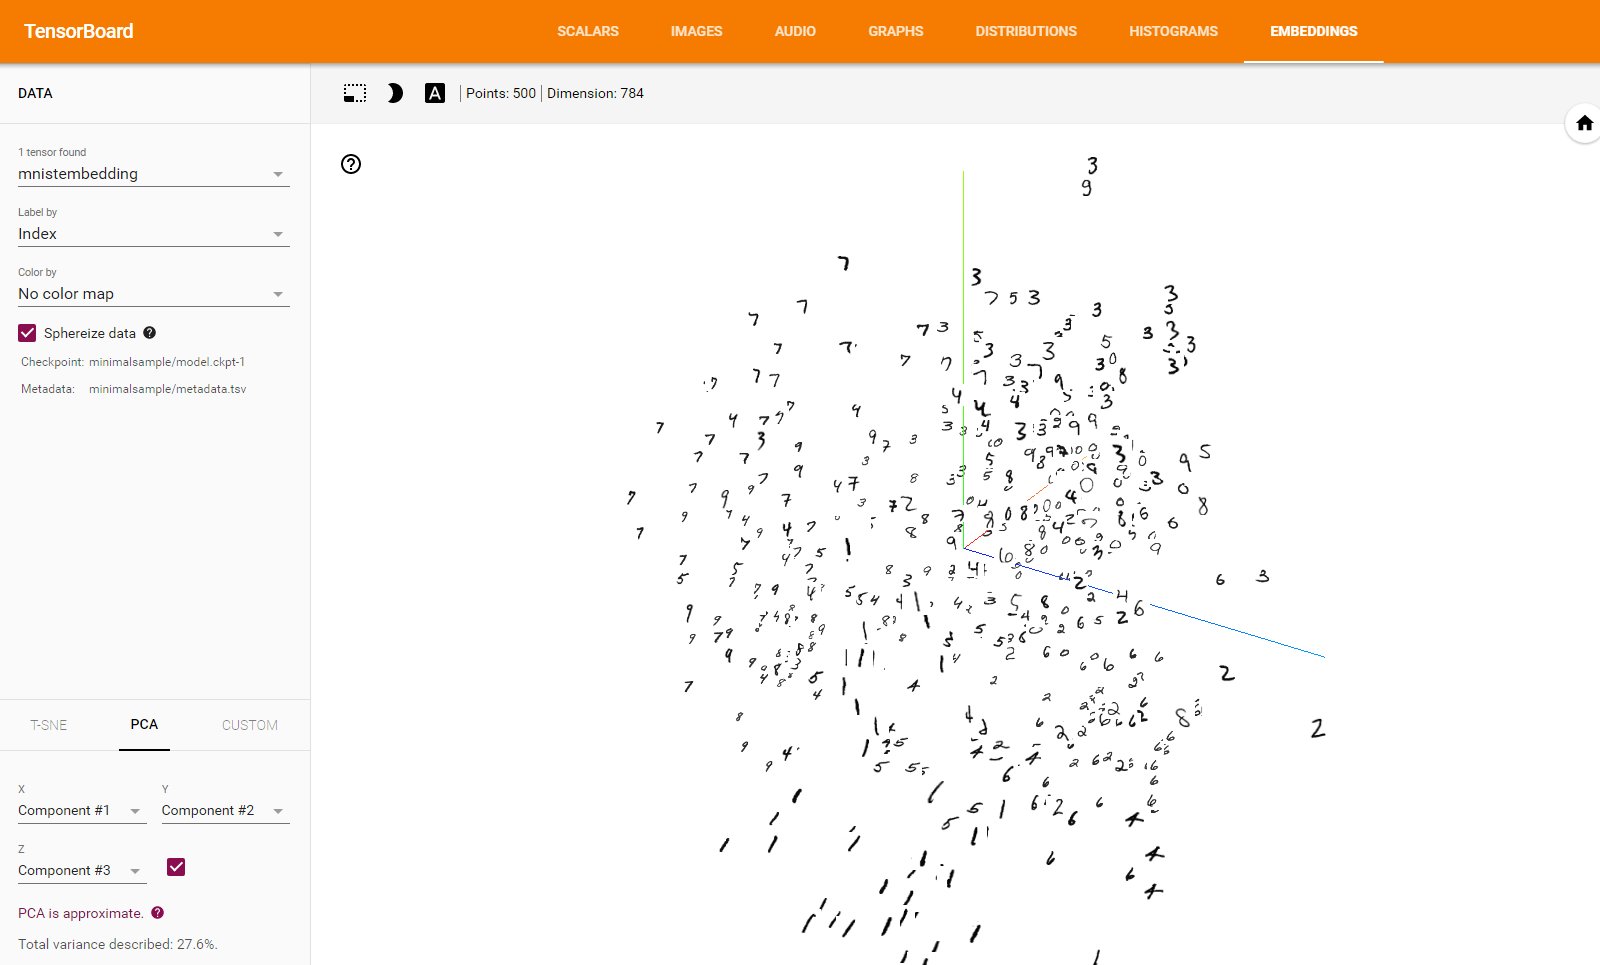
用浏览器打开http://127.0.0.1:6006(注意:可能会根据自己的电脑设施修改),将会在Embeddings标签中看到下图(老版本的TensorFlow没有Embeddings标签,需要对TensorFlow升级):
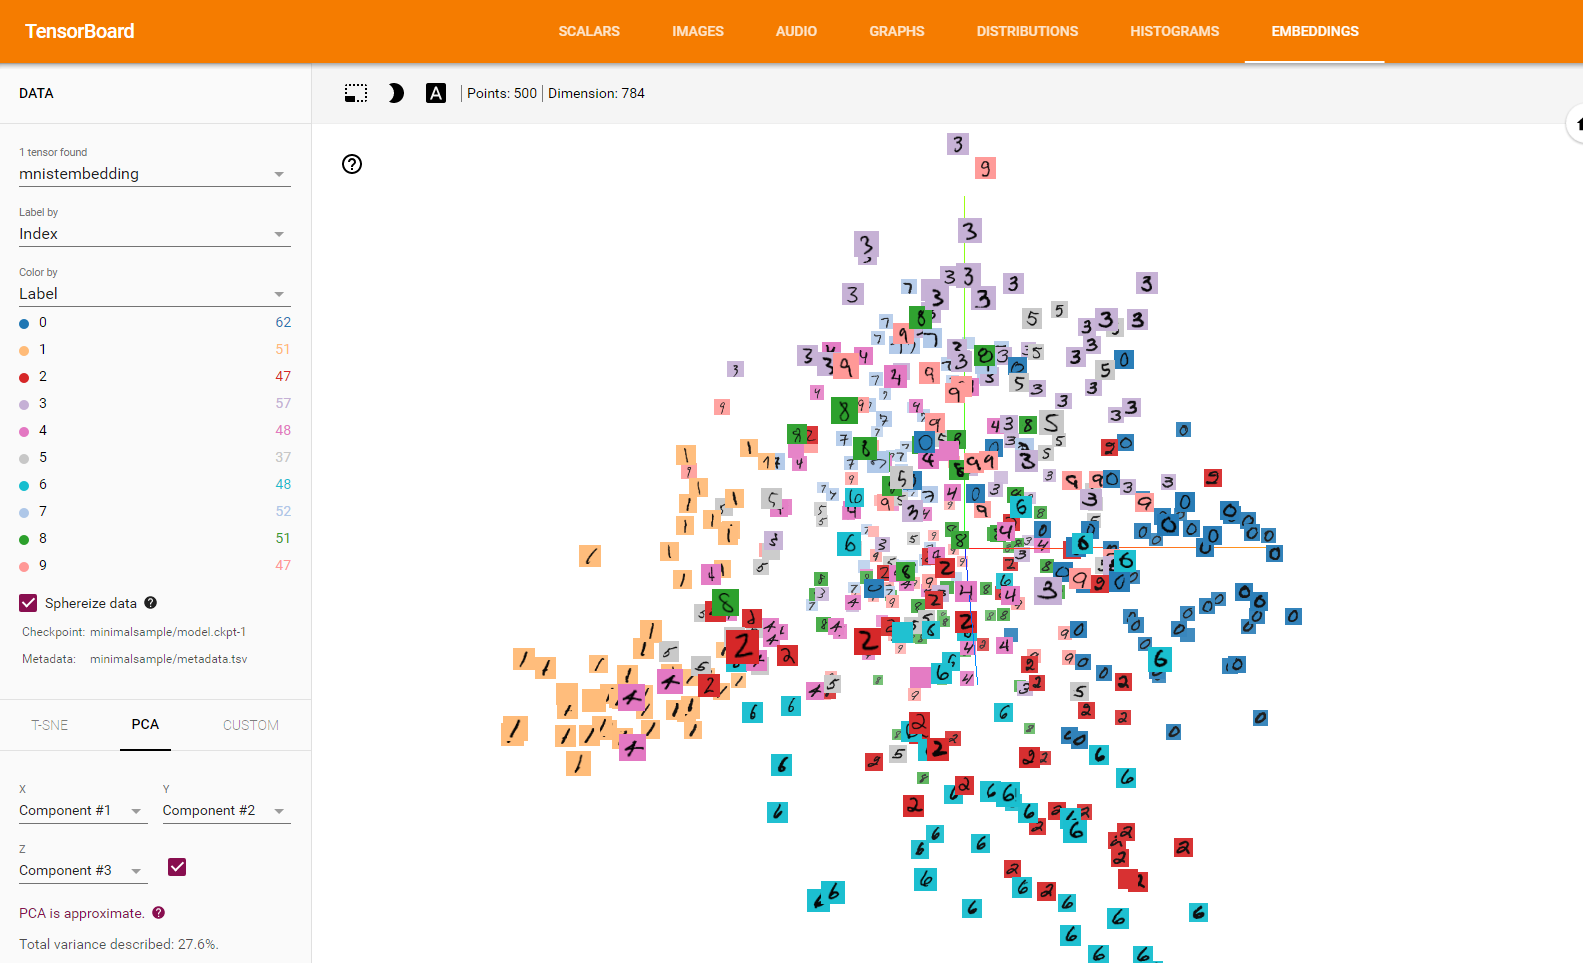
可以在Embeddings标签中看到MNIST数据集的PCA,点击左侧的“color by”选择器并选择Label,将会看到更加漂亮的分组。(0互相靠近,6互相靠近,等等)
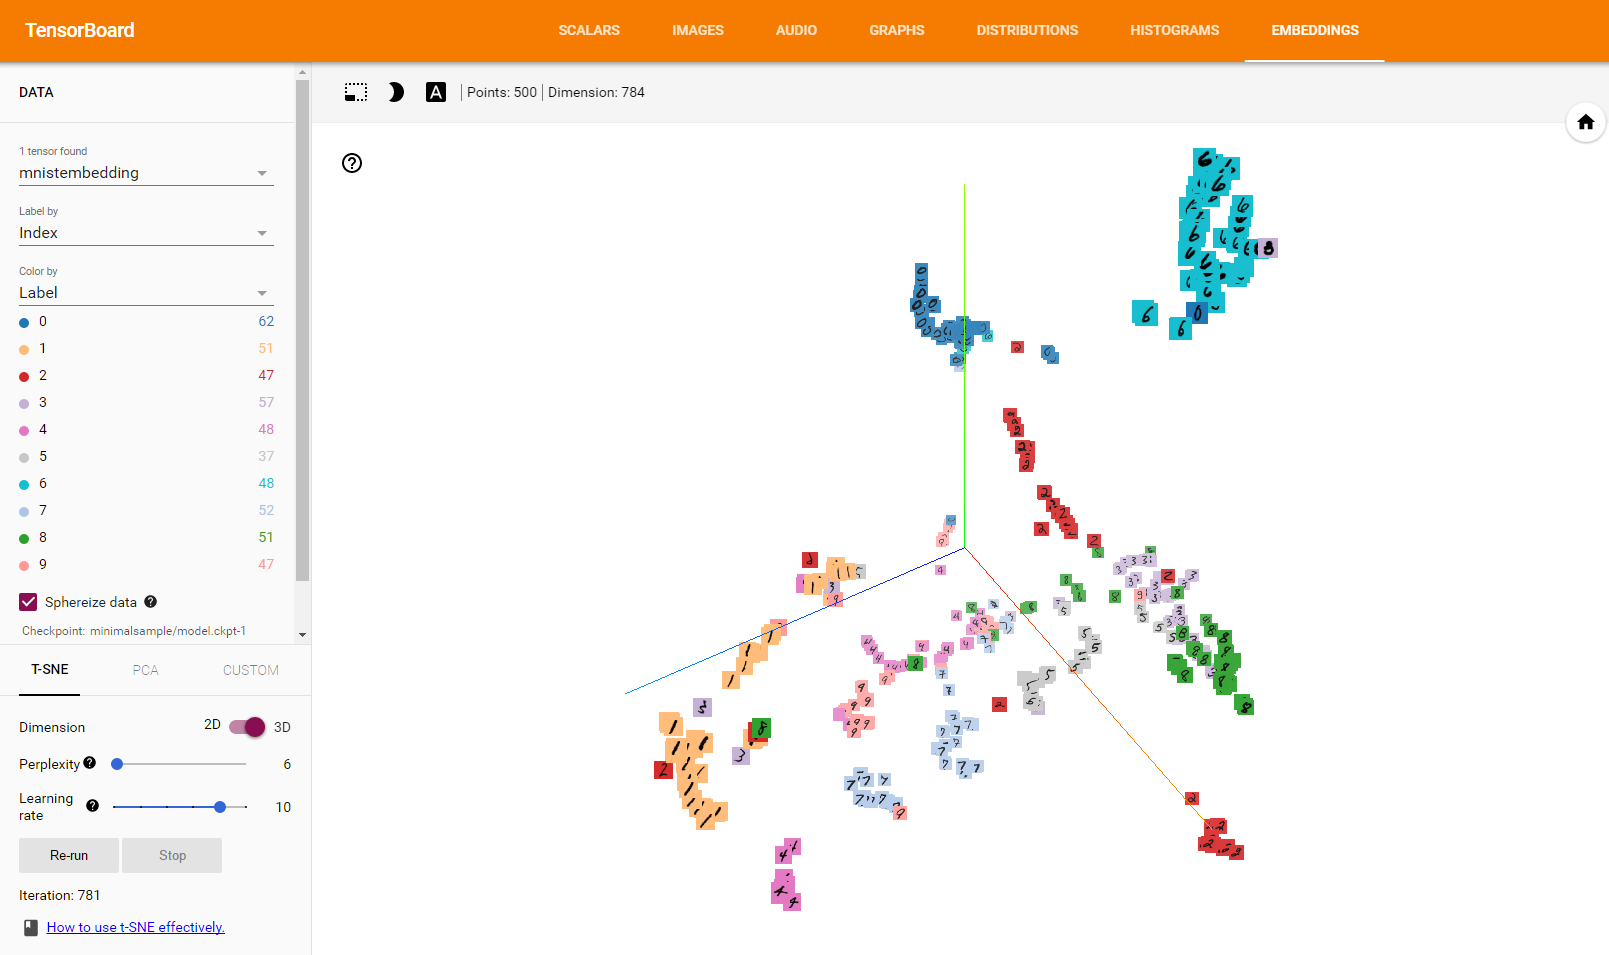
也可以尝试T-SNE来观察当数据样本试图形成群体时,数字会移动。
如果TensorBoard有问题无法显示,可以尝试改变LOG_DIR。可以将metadata和sprite文件的相对路径改为绝对路径。LOG_DIR = os.getcwd()+'/minimalsample'
参考资料